Diagnostics
The live log, newest first. Every line carries the time, its severity, the source that emitted it, and the message.
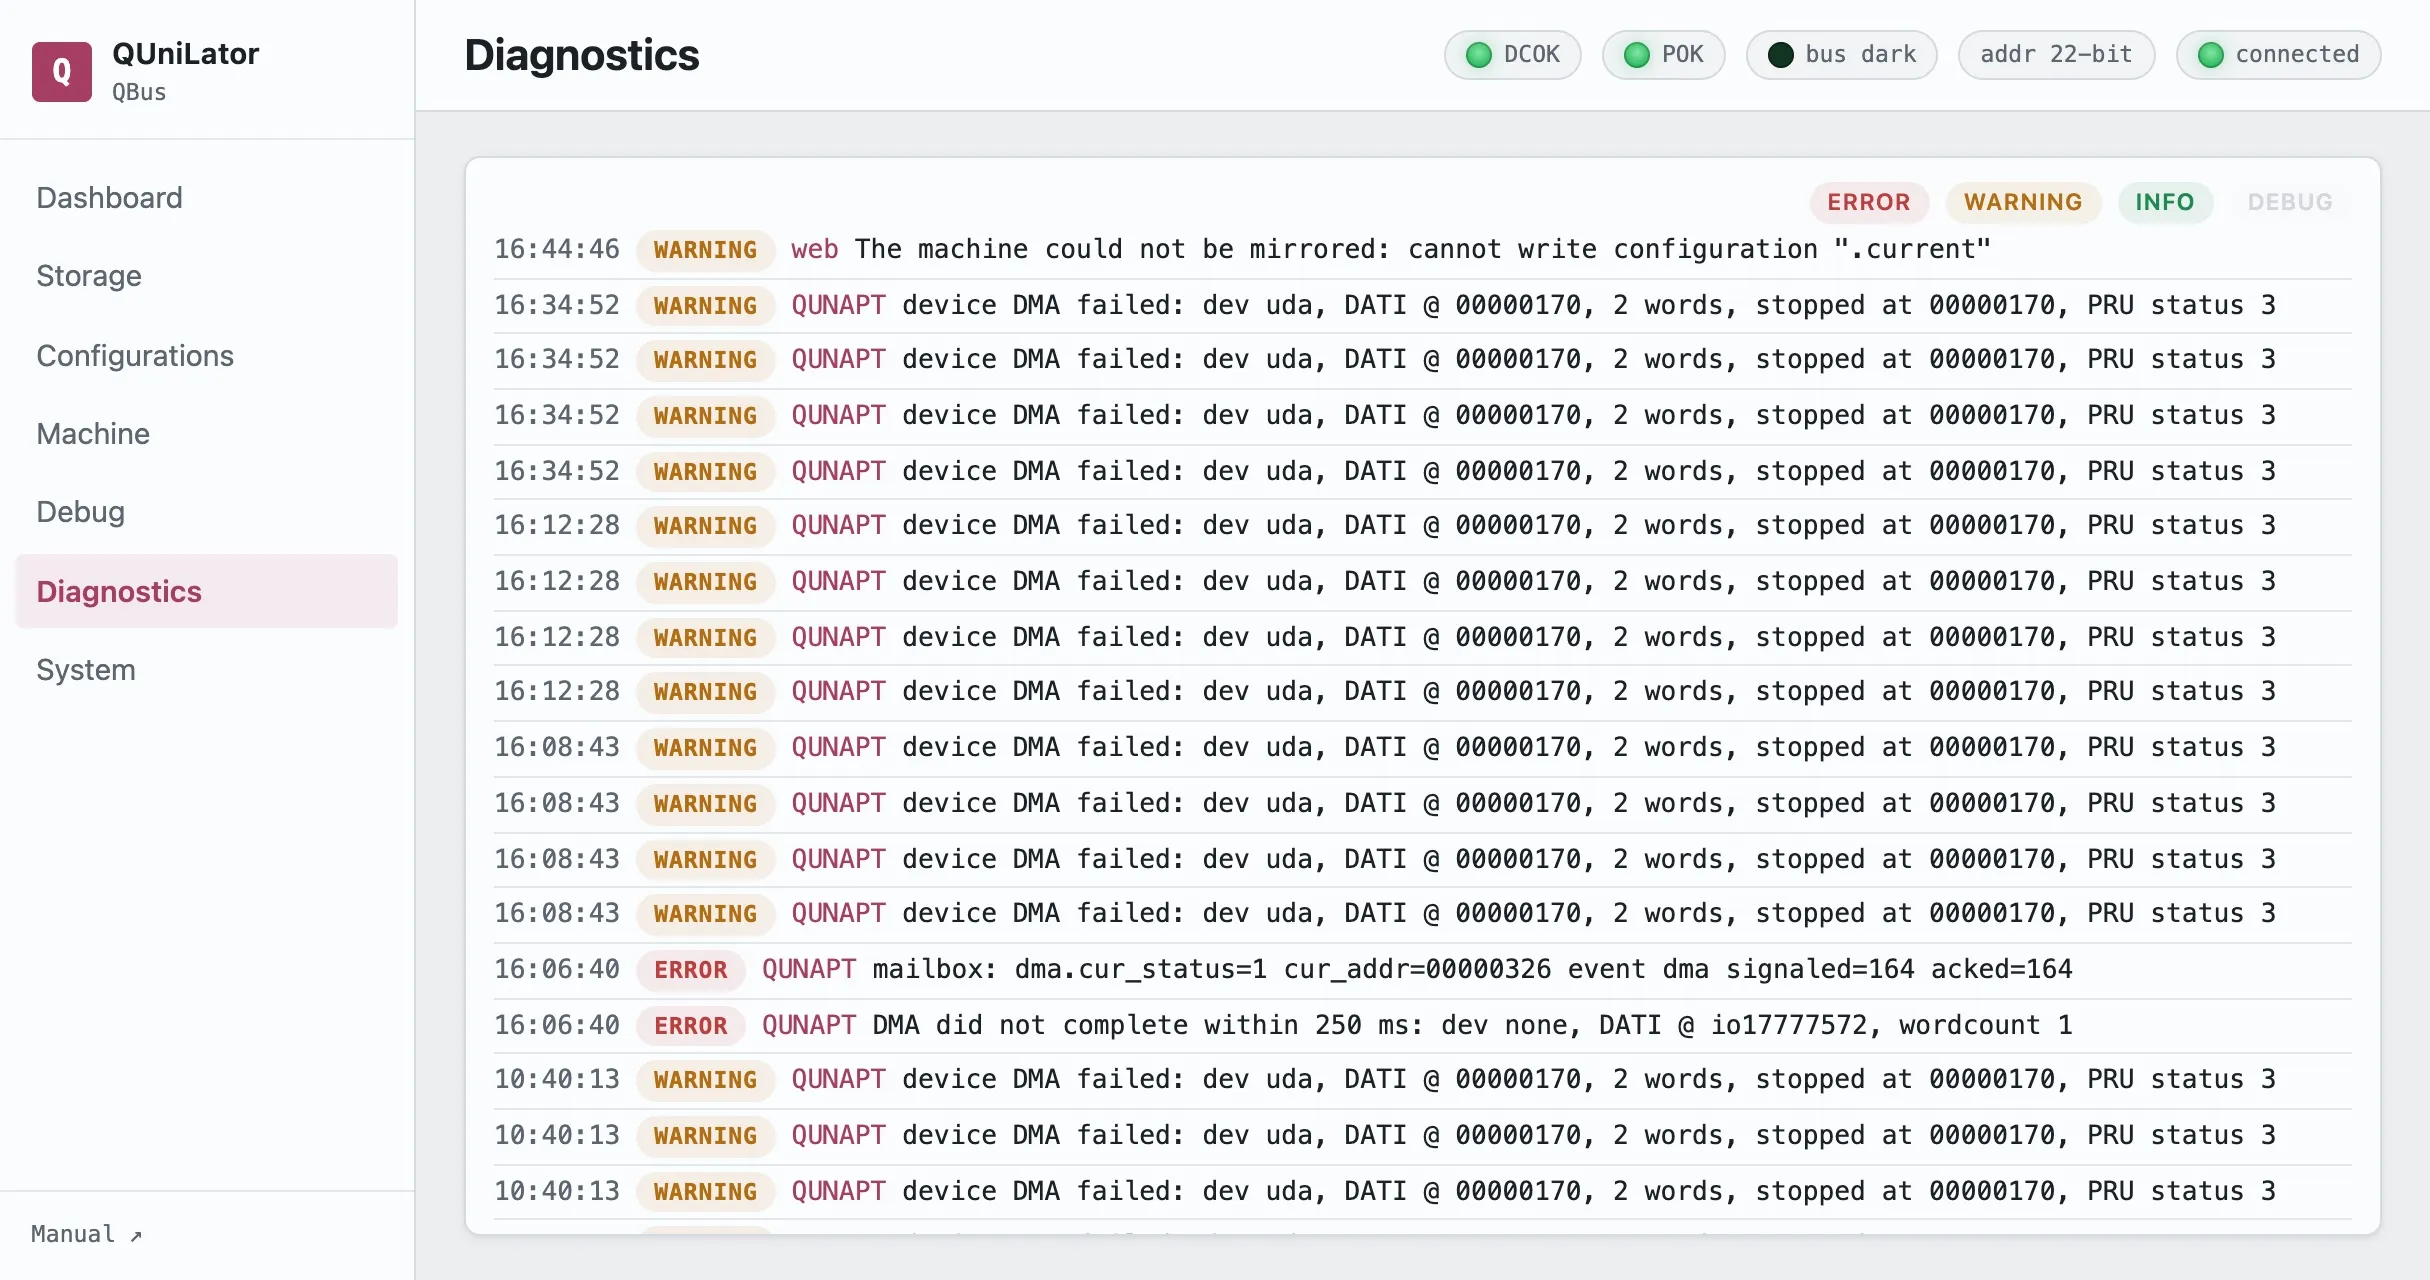
Sources are the parts of the emulator that log: web for the service, QUNAPT
and PRU for the bus and firmware layers, and each device under its own name —
rl, uda, ts, delqa.
The severity chips
Section titled “The severity chips”ERROR, WARNING, INFO and DEBUG across the top filter what is shown. They are a view filter only — they hide and reveal lines that have already arrived, and change nothing about what the emulator emits.
The choice is kept in the page’s address (?levels=…), so a filtered view
reproduces from its URL and survives a reload.
The stream is live, not a journal
Section titled “The stream is live, not a journal”The board keeps no server-side log history: lines are pushed as they happen, over the same event connection everything else uses. What you see is what has arrived since the page connected — scroll for older entries… reaches back only as far as that.
So the log is a thing to be watching while you do something, rather than a record
to consult afterwards. For the record, the board’s own journalctl carries the
service’s output.
Raising a source’s level
Section titled “Raising a source’s level”This screen does not set log levels. Every source sits at warning by
default, so info and debug lines from a device you are chasing are never
emitted — filtering for DEBUG here will show nothing, because nothing was sent.
Changing a source’s level is an API operation (/api/logging), and the
MCP server exposes it as set_log_level. The pattern
is: raise the one source you care about, watch, then put it back — a source left
at debug costs the running machine real time.